Where Sales Are Won or Lost: The Six Gates of the E-Commerce Funnel
Most teams stare at one number — the conversion rate — and treat it like a verdict. It isn't. A single conversion rate tells you that you have a problem. It never tells you where. For that you need the funnel: the six measurable gates every visitor passes on the way to revenue. Read the drop-off at each gate and the funnel stops being a report and becomes a diagnosis — one that points at a specific fix, and usually a specific team.
This is the field guide we give e-commerce managers. No hot takes: we pulled the benchmarks from the people who actually measure them — Baymard Institute, Dynamic Yield, Littledata and a Google-commissioned Deloitte study — and marked clearly what's an average versus what's illustrative. Sources are at the bottom.
The six gates
Think of the journey as a chain of six gates. Each has exactly one headline KPI and one formula. If you can't name the number at every gate, you can't find your leak.
| Gate | Headline KPI | How it's measured |
|---|---|---|
| 1 · Traffic | Visitors / sessions | Platform-reported. The denominator for everything below. |
| 2 · Product interest | Product-view rate | product-page views ÷ visits × 100 |
| 3 · Intent | Add-to-cart rate | add-to-carts ÷ product views × 100 |
| 4 · Purchase intent | Checkout rate | checkouts ÷ add-to-carts × 100 |
| 5 · Sales | Conversion rate | orders ÷ visits × 100 |
| 6 · Efficiency | Revenue per visitor | revenue ÷ visitors (= CR × AOV) |
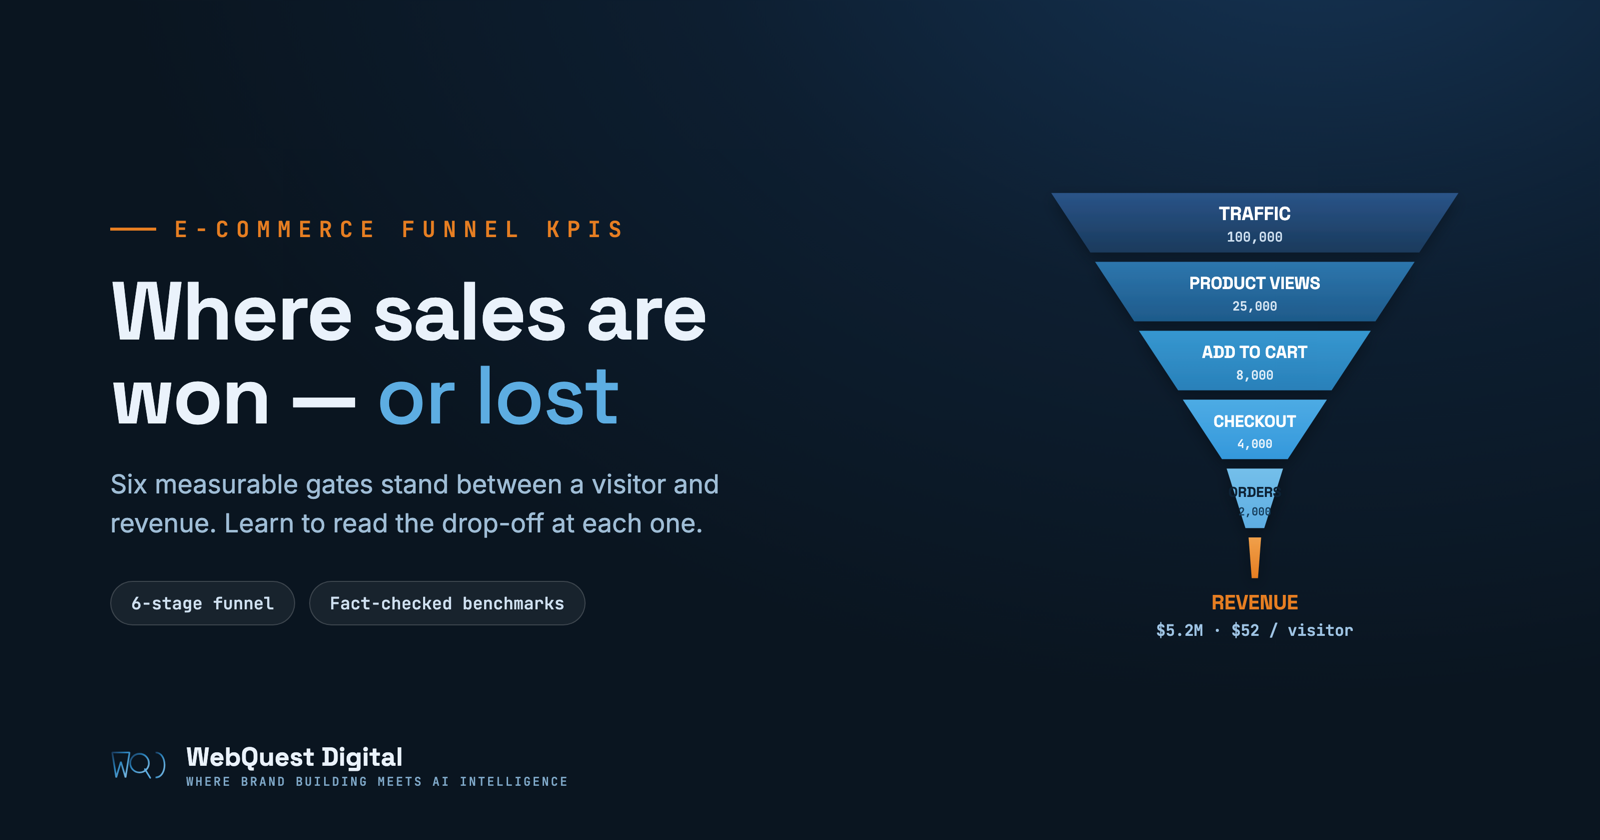
A worked example makes the math concrete. Take 100,000 visitors: a 25% product-view rate leaves 25,000; a 32% add-to-cart rate leaves 8,000; a 50% checkout rate leaves 4,000; a 2.0% overall conversion rate lands 2,000 orders and, at a healthy basket, roughly $5.2M in revenue — about $52 per visitor. Those percentages are illustrative, chosen to teach the arithmetic. Your real numbers depend heavily on category, channel and device — which is exactly where most managers go wrong with benchmarks.
If you track only three KPIs, track these
Six gates, but three numbers carry the weight:
- Checkout rate — where intent meets friction. It's the fastest ROI in the funnel because most fixes are pure design, not new traffic.
- Conversion rate — the board-level number, but an average of averages. It's meaningful only once you split it by device and channel.
- Revenue per visitor (RPV) — the north-star. Because RPV = conversion rate × average order value, it stops teams from "winning" conversion by discounting away their margin.
Why not just conversion rate? Because it can rise while revenue falls (deep discounts), or hide a broken cart behind unusually good traffic. The trio together can't be gamed by any single tactic.
There is no "good" conversion rate — only your category's
This is the most expensive misconception in e-commerce. A 2% conversion rate is excellent for luxury and poor for food & beverage. Dynamic Yield's benchmarks — aggregated across 400+ brands and hundreds of millions of sessions — show the spread plainly:
| Category | Conversion rate | Add-to-cart rate |
|---|---|---|
| Food & Beverage | 5.29% | 10.43% |
| Pet Care (peak month) | up to 7.15% | — |
| All-industry average | ~2.2–3.2% | ~5.5–6.9% |
| Fashion & Apparel | 1.9% | — |
| Luxury & Jewelry | 0.70% | 1.72% |
The rule that follows is simple: benchmark each category, and ideally each device and channel, separately. Never judge your funnel against a single global average — it will either flatter you or scare you, and both are useless.
The mobile paradox
Three in four sessions now arrive on a phone — 75.6% of traffic over the trailing year — yet phones convert well below desktop. Littledata's Shopify data puts mobile at a 1.2% average conversion rate against desktop's 1.9%. In other words, your biggest audience is your weakest converter, and the gap is almost pure friction: tiny tap targets, slow pages, fiddly checkout forms.
Your funnel is a mobile funnel whether you designed it that way or not. Audit every gate on a real phone — that's where the largest, most winnable conversion gap usually lives.
Why seven in ten carts never convert
The single biggest leak in most funnels sits between cart and checkout. Baymard's average across 50 studies is a 70.22% cart-abandonment rate. Not all of that is fixable — 43% of shoppers abandon simply because they were "just browsing / not ready to buy," which is a natural part of how people shop. But strip that segment out and the remaining reasons are strikingly addressable:
- 39% — extra costs too high (shipping, tax, fees)
- 21% — delivery was too slow
- 19% — didn't trust the site with card details
- 19% — forced to create an account
- 18% — checkout too long / too complicated
- 14% — couldn't see the total cost up front
- 10% — not enough payment methods
Almost every item on that list is a design decision, not a market condition.
The cheapest revenue you'll find this quarter
Fixing checkout is the highest-leverage work in e-commerce because you're recovering shoppers you already paid to acquire. Baymard's testing shows the average large site can lift conversion by 35.26% through checkout design alone — which, across US and EU e-commerce, adds up to an estimated $260 billion in recoverable orders. The playbook is unglamorous and reliable:
- Show the total cost early. Surprise shipping and tax at the final step is the number-one reason at 39%.
- Offer guest checkout. Forcing account creation costs you ~19% of ready buyers.
- Cut the form. The average US checkout shows 23.5 form elements; an ideal flow needs 7–8 fields. Most checkouts can safely remove 20–60% of what they display.
- Add trust and payment options. Security cues plus wallets (Apple/Google Pay, BNPL) directly answer two of the top reasons.
- Be honest about delivery. Slow or vague delivery loses 21%.
The one-line business case
A leaner checkout is the rare initiative where the upside is large (+35% conversion on average), the cost is low (design, not media spend), and the evidence is a decade deep. If you do one thing after reading this, shorten your checkout.
Speed is a gate you can't see
There's a seventh, invisible gate draining all six: page speed. Google and Deloitte isolated site speed as a single variable and measured the lift from a tiny 0.1-second mobile improvement across real retail, travel and luxury brands. The direction was unambiguous:
These are measured correlations from real sites, not a guarantee for yours — but no vertical in the study got worse when it got faster.
Small gains compound — which is why funnel work beats buying traffic
The funnel is a chain of multiplications, so improvements stack. Take the same 100,000 visitors and lift three gates modestly — a few points on add-to-cart, a few on checkout, a fraction on the final conversion — and orders climb from 2,000 to well past 2,600. That's a 30%+ revenue gain with zero extra traffic. A small win at three gates beats a heroic effort at one, and it's far cheaper than buying your way to the same result at the top of the funnel.
A weekly cadence that actually moves numbers
Turn all of the above into a rhythm:
- Measure — pull the six gates weekly, split by device and channel, using the same definitions every time.
- Diagnose — find the single biggest percentage drop between two adjacent gates. That's your priority, not the stage with the scariest absolute number.
- Test one thing — ship a single change at that gate and A/B it wherever volume allows, so the result is attributable.
- Bank and repeat — keep winners, revert losers, re-scan. The leak moves; so should your focus.
One well-isolated test a week, compounded over a quarter, beats a big-bang redesign you can't attribute. Track weekly, analyse the drop-offs, optimise every step — and remember that every point of conversion you recover is the highest-margin growth in e-commerce, because it lives inside the funnel you already own.
Sources
- Baymard Institute — "49 Cart Abandonment Rate Statistics" (70.22% average; reasons for abandonment; checkout field counts; +35.26% and $260B recoverable).
- Dynamic Yield (XP² benchmarks) — "eCommerce KPI benchmarks" (device split, conversion, add-to-cart and AOV by industry; 400+ brands, trailing 12 months to May 2026).
- Littledata — "What is the average ecommerce conversion rate?" (median, mobile, desktop and top-decile conversion; 2,800 Shopify stores, 2023).
- Deloitte & Google — "Milliseconds Make Millions" (site-speed impact on conversion and AOV; data by Fifty-Five, 2020).